

If you know Dave Feldman, you probably know of his running commentary on the lipid energy model and lean mass hyper responders (LMHRs). These are relatively new concepts that are becoming increasingly popular among low-carbohydrate advocates, and evermore controversial in the broader nutrition space. Although there are many nuances and assumptions that surround these concepts, which we will shortly touch on, one thing that’s clear is that groups of people are using these concepts to downplay the significance of low-density lipoprotein (LDL) in changing cardiovascular disease (CVD) risk. I’ve heard people start to use these concepts to reject potentially life-saving LDL-lowering medications, and in public discussions, I frequently hear them used to defend the healthfulness of high LDL in specific contexts. It’s fair to say, then, that these concepts are most definitely worth reviewing, especially since CVD is a major public health concern and we should aim to avoid unnecessary harm. In this article, I hope to clarify what the lipid energy model and LMHRs are, what Dave’s hypotheses are, and how they relate to CVD.
The Lipid Energy Model
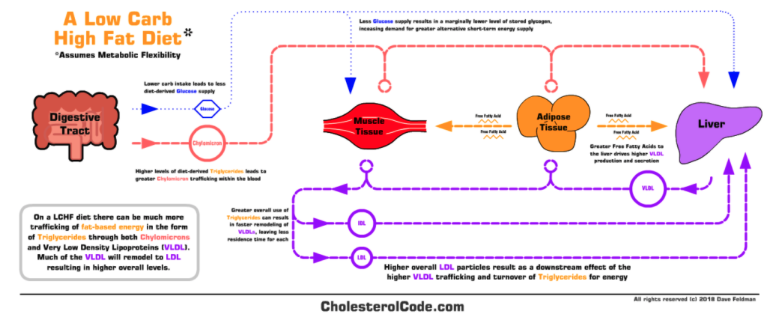
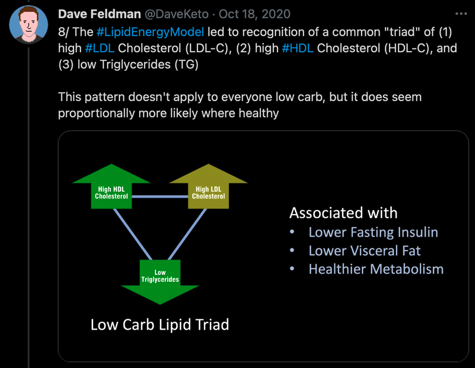
According to Dave’s interview on The Fatty Joe Show, he began a ketogenic diet in April 2015 and noticed his blood lipids spiked substantially. As an engineer by trade, he admittedly became obsessed with trying to figure out why this happened. Dave understood that saturated fat was the common explanatory variable for such dramatic lipid changes, but he believed there was more to the story. In the coming years, Dave put forth the lipid energy model to explain why many people undertaking a low-carbohydrate diet notice a similar, large increase in blood cholesterol and LDL-concentrations (LDL-C). Dave posited that such an increase can be explained not only by an increase in saturated fat intake, but also a physiological adaptation to support the trafficking of (extra) fat around the body, as lipoproteins are the primary means of fat transportation in humans.
In a summary Youtube video, Dave hypothesises that if an individual is healthy and starts a low carbohydrate diet, there will be greater free fatty acid release from fat cells to the liver and other tissues in need. The increased liver flux of FFA is what increases the secretion of triglyceride-rich lipoproteins such as very-low density lipoprotein (VLDL), which then increases circulating levels of LDL since LDL particles are simply VLDLs relieved of some TG content. A direct from Dave is is that, “We believe higher total and LDL cholesterol levels in those going on a low carb diet can be in part explained by greater synthesis, secretion, and turnover of triglyceride-rich VLDL, thus leading to a higher resulting quantity of LDL particles, particularly with LMHRs”.
None of the above mechanistic speculations are particularly dangerous in and of themselves, but it is how Dave relates them to his LMHR hypothesis where things start to get interesting. As we will later come to see, the lipid energy model essentially provides Dave’s backbone argument for the LMHR hypothesis, which is far more outlandish and potentially harmful. For this reason, before we move on to LMHRs, I’ll examine the lipid energy model in terms of its supporting evidence base.
Surprisingly, though, Dave does not offer much in the way of peer-reviewed literature to support the lipid energy model. After listening to numerous presentations and podcasts from Dave, and going through his website content, the lipid energy model appears to be almost entirely a mechanistic construction from various anecdotes, personal experiments, and rodent studies. These three areas cover the vast bulk of Dave’s presentations and discussions.
One reference that Dave does like to cite, however, is a cross-sectional study on ultra-endurance athletes from Creighton et al. [1]. This research group measured the fasting blood of competitive male ultra-endurance runners habitually consuming a very low-carbohydrate (n=10) or high-carbohydrate (n=10) diet to analyse differences in their blood lipid profiles. The results were that the very-low carbohydrate athletes had almost double the LDL-C than high-carbohydrate athletes, along with significantly higher high-density lipoprotein concentration (HDL-C). TG were not significantly different between the groups, allowing the TG:HDL ratio to also differ significantly. At first, these group differences seem rather striking and Dave, along with many others, has previously used these results to support the validity of the lipid energy model.
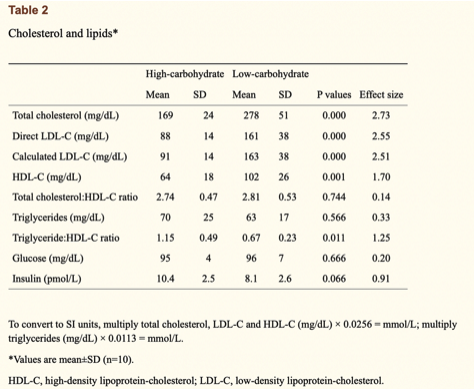
And they might indeed, but it’s definitely far from clear-cut. The study authors made a crucial note that the very-low carbohydrate athletes had, on average, a ~400% higher intake of saturated fat (86 vs 21 grams per day), ~300% higher intake of dietary cholesterol (844 vs 251 mg per day), and ~50% lower intake of dietary fibre (23 vs 57 grams per day) compared to the high-carbohydrate athletes. As we know that all of these nutritional components can influence total cholesterol and LDL-C to varying degrees, we therefore cannot be certain of the lipid energy models’ independent effect on the lipid differences between groups here. After all, the lipid energy model says nothing about diet quality, focusing solely on macronutrient quantities and how they’re trafficked around the body. This point must be emphasised considering the vast amount of data, including both randomised controlled trials (RCTs) and prospective cohorts, that show LDL-C levels are strongly influenced by changes in saturated fat and dietary fibre intake.
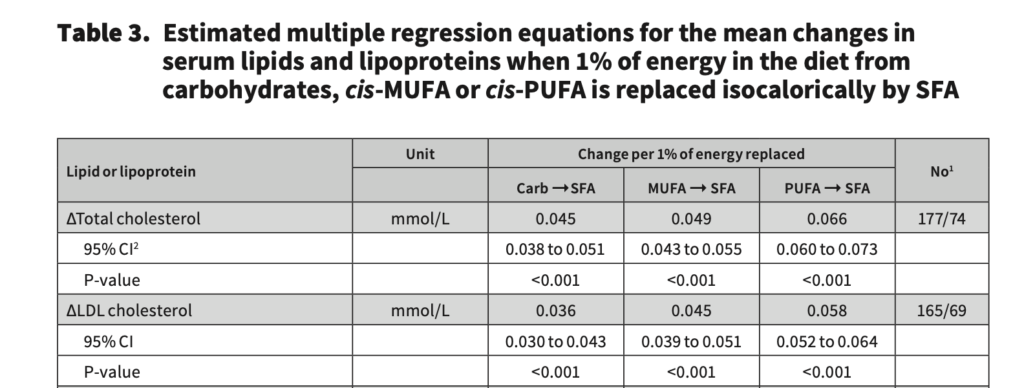
We can do a little bit of math here to illustrate why dietary quality poses an issue when validifying the lipid energy model. The most comprehensive systematic review and meta-regression analysis of RCTs has estimated that for every 1% energy substitution of either carbohydrate or unsaturated fat for saturated fat, LDL-C increases by 0.036 – 0.058 mmol/L (1.39 – 2.24 mg/dL).
So, if we then take the dietary information from the Creighton et al. [1] study, with both high and low carbohydrate athletes consuming ~3000kcal per day, and the very-low carbohydrate diet group consuming 576 more kcal from saturated fat per day, this equals to ~19% more energy from saturated fat in the very-low carbohydrate group. Then, if we take the estimated LDL-C change per 1% substitution in energy for saturated fat (1.39-2.24mg/dL), and times it by 19, that is a 26-42mg/dL expected change from group differences in saturated fat alone. For this reason, I don’t think it’s a stretch to assume this contributed to the 73mg/dL change between groups to some degree; although granted, saturated fat cannot fully explain the differences in LDL-C. I imagine the differences in dietary fibre and cholesterol intake between groups will only close the LDL-C gap further, but to what extent is unknown. Dave might speculate that the lipid energy model explains some of the LDL-C difference between groups, but I will reiterate that the questions of “if?” and “how much?” is an educated guess for anyone.
The same line of argumentation applies in many of the other studies that Dave or others use to support the lipid energy model. Another study that Dave often refers to provides recent insights into 5 individual patients that experienced dramatic changes in their lipid panel while losing weight on a ketogenic diet, for example. The study in question did not report on these individual cases to showcase the common effects of a ketogenic diet, but it did publish these cases to highlight what is possible when transitioning to a ketogenic diet. Thus, the paper is relevant to the lipid energy model and this commentary. The exact changes in the patients’ lipid measures are shown in the table below.
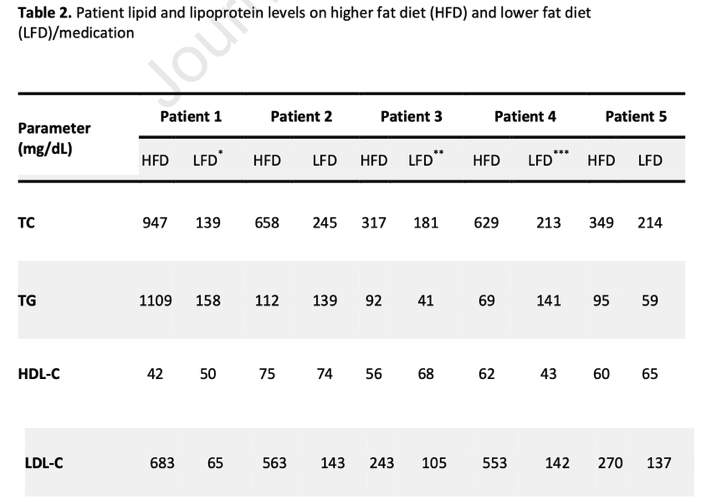
After transitioning to a ketogenic diet, the collective individual differences from baseline were dramatic: total cholesterol increased between 163 – 680%; TG changed between -20% – 700%; HDL changed between -18% – 1%; and LDL-C increased from 197% – 1050%. Thus, although the total cholesterol and LDL-C increases are certainly in line with expectations from the lipid energy model, the slight decrease in HDL-C and increase in TG are not expected results. I’ll hazard a guess that Dave would suggest these unexpected results are because the 5 patients don’t fit with his “healthy” definition that the lipid energy model was founded on. That’s fine (although patients 2, 3, and 4 were a healthy BMI). The more pertinent issue with this paper, however, is that similar to the patients’ dietary composition in the Creighton et al. study, each of the 5 patients here, other than patient 3, were following an animal-based and presumably high saturated fat diet: patient 1 followed an Atkins diet; patient 2 followed a high animal protein and fat diet including cheese and butter; patient 4’s main fat sources were coconut oil, bacon fat, butter, and MCT’s; patient 5’s sources of fat included bacon fat, heavy cream, butter, and olive oil. So, again, it is hard to get much of an idea of the effects of the lipid energy model independent of dietary quality changes. While we certainly know the lipid panel changes from a ketogenic diet can be dramatic, how much of that change is explained by the lipid energy model is up for question when poor diet quality expectedly changes these lipid markers.
Clearly then, there is a need to analyse some more robust data if the lipid energy model is to be considered validated, preferably of which has a control group to avoid diet quality issues. This brings us to an RCT by Retterstol et al., which is the study most often used to try and diverge these issues. This research group explored the effects of an ad libitum, interventional, very-low carbohydrate diet (<20 grams per day (ketogenic by most definitions) versus a control diet (maintaining baseline diet) on plasma LDL-C and other lipid measures in 30 young and healthy adults. It would be fair to classify these adults as “healthy” by standard definitions given they were in the healthy BMI range, had no chronic disease, avoided high alcohol consumption (<14 units per week), did not regularly use medications, and did not have high blood pressure (≥140/90 mmHg). Body composition measures and fasting blood samples were taken at baseline and after 3 weeks of intervention. And as seen in the table below, despite no significant changes in body weight between dietary groups, the plasma levels of total cholesterol, LDL-C, HDL-C, ApoB and ApoA1 and free fatty acids (FFA) increased significantly from the very-low carbohydrate diet compared to the control diet. The mean plasma LDL-C difference was particularly pronounced, with a 44% increase from the very-low carbohydrate diet compared to control, while HDL-C increased by a smaller margin of 19%. TG remained unchanged between groups. Therefore, other than the lack of difference in TG, a controlled study such as this may also be taken as supporting evidence for the lipid energy model.
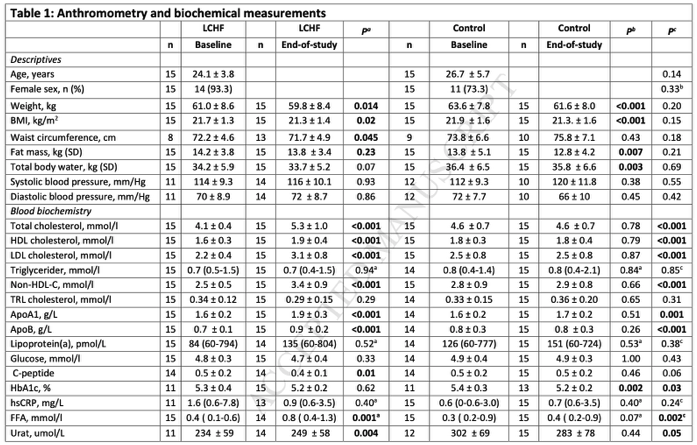
However, we again run into similar issues as before, as the foods used in the very-low carbohydrate intervention diet were largely self-selected and the type of preferential fat choice was optional. As we can see from the dietary composition analysis, the very-low carbohydrate group still had an 18% higher intake of saturated fat (relative to total energy intake) than the control group over the 3 week period, plus a 410% higher dietary cholesterol intake, with essentially no difference in dietary fibre intake. This clearly indicates that, yet again, the very-low carbohydrate diet was primarily animal-based and changed nutrient intake from baseline to a degree coherent with (some) expected movement in blood lipid panels.
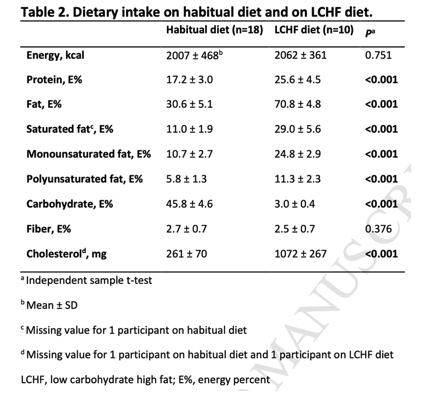
If we do some basic math like before, and say we estimate that for every 1% substitution in energy for saturated fat, LDL-C increases by 1.39 – 2.24mg/dL, we could actually make a case that > 70% of the 35 mg/dL increase in LDL-C from the very-low carbohydrate group can be explained by the 18% difference in total energy intake from saturated fat alone. If we add any further influence from the vast dietary cholesterol differences, then the effects explained by the lipid energy model may gradually fade to zero. This is not to say the lipid energy model is not a possible explanation for some lipid changes in response to a low-carbohydrate diet, but we simply cannot say how much of the lipid changes are independent of diet quality differences.
Anyway, let’s move on to some of the bigger issues.
Daves LMHR Hypothesis
I first covered the lipid energy model because it ties into the next concept by Dave, LMHRs. The lipid energy model and LMHRs are two distinct ideas, but the former is used as an explanation for the latter. Hyper-responders, as per Dave’s definition from his ‘Low Carb Down Under’ presentation, are a subset of individuals that see an increase in total and LDL-C from changing to a low-carbohydrate diet, and LMHRs are a further subset of hyper-responders that notice the most dramatic increases. As per Dave’s site, The Cholesterol Code, the precise definition of an LMHR is having a lipid profile of LDL-C >200 mg/dL, HDL-C >80 mg/dL, and TG <70 mg/dL. Dave also states that LMHRs are not exclusively those following a low carbohydrate diet, but that LMHRs have common characteristics such as a low body fat percentage (≤20% men, ≤23% women), being fit and athletic, and anecdotally speaking, tend to follow a very low carbohydrate diet (typically < 25 grams of net carbs per day). Dave also suggests there are 4 main factors determining if someone is a hyper-responder or not, which are familial hypercholesteremia, having one or two copies of the ApoE4 gene, hypothyroidism, or a cholesterol hypersynthesiser.
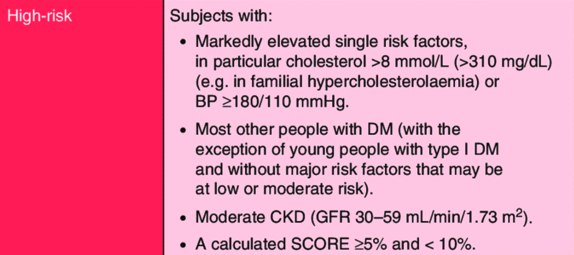
But simply defining a group of individuals is not the interesting part here. What is interesting is how Daves’s perspective of LMHRs ties into their risk of CVD relative to population risk categories. As may have been obvious to you during the LMHR criteria, LDL-C > 200mg/dL is considered extremely high by all current definitions and would be an obvious concern for most doctors trying to identify risk factors in their patients. Generally speaking, LDL-C above 190 mg/dL is considered very high, and this alone typically warrants LDL-lowering therapy to reduce CVD risk in clinical settings. The CVD management guidelines from organisations such as the European Society of Cardiology also state that markedly elevated single risk factors automatically place you in a high-risk CVD category, regardless of other risk factors.
This becomes relevant background information when understanding that Daves’s hypothesis is that when high LDL-C is met with high HDL-C and low TG, such as is the case with LMHRs, CVD risk may not put you at a high risk of CVD. Dave’s direct response to the question as to whether the LMHR profile is risky (whatever that means) is simply “we don’t know“.
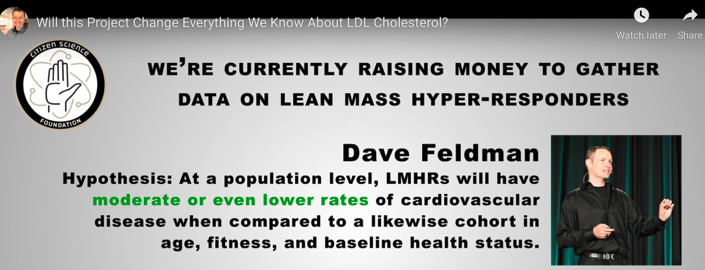
 Dave has actually made stronger hypotheses and statements than this. In one of his presentations covering this topic, Dave hypothesises that “LMHRs will have moderate or even lower rates of cardiovascular disease when compared to a likewise cohort in age, fitness, and baseline health status”. This hypothesis goes one step further than LMHR’s simply not being high risk for CVD, then, as it implies that LMHRs may actually hold a unique advantage for CVD prevention even when other major CVD risk factors are considered. Quite a bold statement and one that clearly opposes the current CVD management guidelines.
And as I mentioned earlier, Dave uses his lipid energy model and opinions on HDL and TG to justify the above LMHR hypotheses. He argues that non-LDL changes that result from the lipid energy model (high HDL and low TG) are independently and collectively cardio-protective, and that CVD risk categories should be based on the overall lipid panel rather than any single lipoprotein. He also goes as far to say the overall LMHR lipid profile, inclusive of high LDL-C, is actually an indicator of a “metabolically healthy system” (again, whatever that means). Both of these explanations lead Dave to make the following statement at minute 48:03 of Daves 2019 Salt Lake talk: “LDL being high or low is not something that I would act on for myself or act on for my family, and I would hope that you shouldn’t feel like you should aswell. There are a lot of people who when they see my research take that as I don’t need to pay attention to my lipid panel anymore, and I’m telling you I pay more attention to lipid panels than I ever have in my life. It’s just that I care a lot more about TG and HDL, and you can see why”.
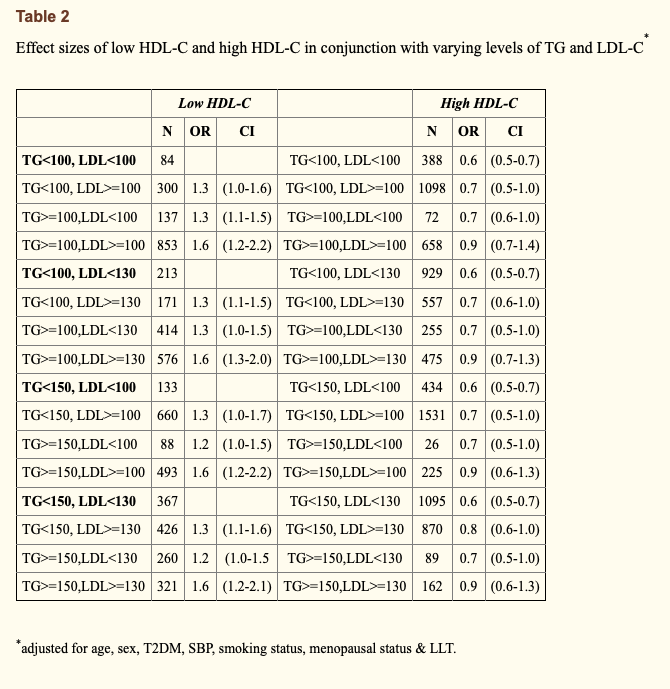
 Second, Dave uses a couple of human outcome studies to suggest that high LDL-C does not necessarily amount to high CVD risk. Both of these studies are used as Dave’s go-to reference points for showing that higher LDL-C has only a small influence on CVD risk when HDL-C is high and TG are low, supposedly anyway. The first study that Dave points toward is a late insight into the classic Framingham Offspring study; a 20-year prospective cohort to inform on cardiovascular disease risk factors. This particular insight evaluated the baseline lipid measurements of 3,590 adults from the Framingham cohort and how they influenced CVD incidence rates over the 20-year study period. The odds ratio of CVD events was calculated relative to “low” (< 40mg/dL for men and < 50mg/dL for women) or “high” HDL-C (> 40mg/dL for men and > 50mg/dL for women), and then further stratified by levels of LDL-C (< 100mg/dL, > 100mg/dL, < 130mg/dL, > 130mg/dL) and TGs (< 100mg/dL, > 100mg/dL, < 150mg/dL, > 150mg/dL). On Daves’s website discussing the insights, and using the image below, he states that “Studies on those with this “triad” of high LDL-C, high HDL-C, and low TG are limited. But of those studies we’ve found, this profile associates with a low risk of cardiovascular disease overall, though slightly more than its counterpart triad with low LDL-C“. This analysis was after adjustment for age, gender, diabetes, hypertension, and smoking status.

The problem with Dave’s interpretation of the above study, however, is that it’s misguided and he makes a fairly bad statistical error. You see, Dave highlights these two specific odds ratios to argue that as LDL goes from > 100mg/dL to > 130mg/dL, the odds ratio stays the same and therefore LDL-C is not playing a causal role in the context of high HDL-C and low TG. But this is not the case. In reality, the two odds ratios that Dave highlights are being compared to different reference groups. Both reference groups are inclusive of low HDL-C and high TG, but the reference groups differ in their cut-off value for LDL-C. The first odds ratio, highlighted in blue on the table, has a reference group with LDL < 100mg/dL, whereas the second odds ratio, highlighted in purple on the table, has a reference group with LDL < 130mg/dL. If you also look at the supplementary data, these reference groups have an LDL-C difference of 18mg/dL (85 mg/dL vs 103 mg/dL), which doesn’t make it a fair comparison. Although the CVD incidence rates of the reference groups were not provided, we would expect the group with a higher LDL-C cut-off to have higher rates of CVD. Therefore, Dave’s point that this study shows high LDL-C associates with low CVD risk in certain contexts is not an honest assessment, because low risk is always relative to the baseline risk of a reference group. Still, I’ll at least agree with Dave that CVD risk does indeed change within levels of LDL-C as a result of differences in HDL-C and TG.
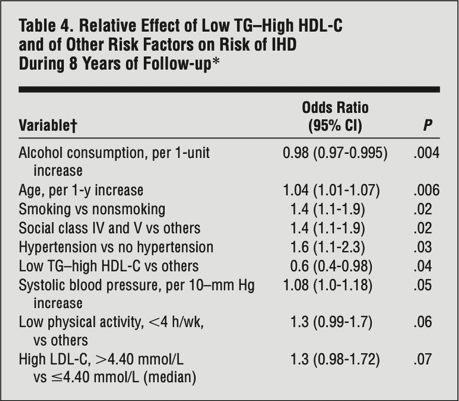
The second common study that Dave uses to support his hypothesis is a prospective cohort study by Jeppesen et al. Dave states that, “In this observational cohort study of 2906 men aged 53 to 74 years free of IHD at baseline, we see this [low risk] relationship as well”. The analysis was similar to that of the prior insights from the Framingham Offspring, although this time the absolute numbers of incidence were far lower and the data stratifications were a little different. The men were subdivided into 3 groups based on serum fasting TG and HDL-C levels: group 1 (TG > 142mg/dL, HDL-C < 46mg/dL), group 2 (TG < 97mg/dL, HDL-C > 57mg/dL) and group 3 (not belonging to group 1 or 2). The participants were then further stratified within these groups by LDL-C (< 170 mg/dL or > 170 mg/dL) and other lifestyle factors. From the results, Dave uses the graph below to try and illustrate that there are only small differences in IHD incidence between low and high LDL-C when HDL-C is high and TG is low, again implying a protective effect of this lipid panel against LDL atherogenicity.
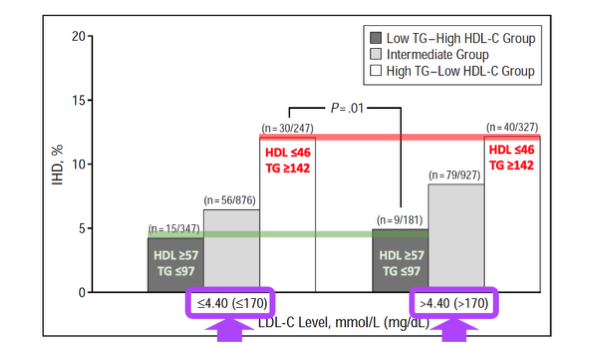
But I disagree. Dave skips over some pretty important details to put this study into context. We need to be aware of what is actually being compared, and in this case, the study is comparing LDL-C > 170mg/dL to LDL-C < 170mg/dL. If we look at the specific mean differences in LDL-C between the two groups separated by the 170 mg/dL cut-off, we see that the absolute mean group differences was only 19.33 mg/dL (158.55 mg/dL vs 177.88 mg/dL). Don’t get me wrong, this is an important LDL-C difference, and is a magnitude similar to the previous Framingham Offspring analysis I just covered, but it’s not a difference that is expected to cause massive contrasts in CVD events when the total number of absolute CVD events is low. This data, therefore, should not be used to support Dave’s theory that high LDL-C poses low CVD risk in the context of high HDL-C and low TG. It’s just showing that CVD risk changes with HDL-C and TG when stratified with levels of LDL-C.
And the issue is that this isn’t anything that we don’t already know. Although there’s a plethora of data clarifying LDL as an independent causal CVD risk factor, it’s already scientific consensus that the net CVD risk is based on the cumulation of all CVD risk factors, not LDL alone. We do not require Dave’s theories to solidify this point further. This being said, I’ll agree with Dave that we still do not know exactly how high LDL-C translates to CVD risk categories in the absence of other CVD risk factors. If someone has very high LDL-C but seems healthy other than that, are they at a low, moderate, or high risk of CVD? I can’t answer that; I can say they’ll be at a higher risk than if they were healthy with lower LDL-C though. The studies Dave cites aren’t providing evidence that current guidelines are wrong. Plus, even if we were to introduce doubt, CVD management guidelines are still more than justified from a safety-first perspective to recommend LDL-lowering until data indicates otherwise. Public health advice is about acting on known-knowns, not unknown-unknowns. A known-known is that the degree of LDL-C lowering confers a linear benefit to CVD risk, regardless of the method used to lower LDL-C. LMHRs are no exception to this rule, and to risk unnecessary harm, they should rightly be treated as high-risk for CVD until evidence suggests otherwise.
Daves Underlying Dangerous Narrative
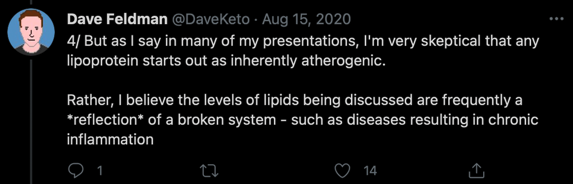
I want to emphasise this point. That is, even if LMHR were (hypothetically) not in a high CVD risk category, this doesn’t change the fact that lower LDL is better for reducing CVD risk and ultimately saving lives. Dave refuses to accept this position based on a limited and shaky pool of evidence. The issue is that Dave’s scepticism might cause some real harm to others. A post from him on August 15th 2020 states that he is “very sceptical that any lipoprotein is inherently atherogenic” but rather “a reflection of a broken system” (i.e. poor health status).
Also, Daves’s response to a recent Twitter question of whether there is a downside to lowering LDL by lowering saturated fat intake and eating more fibrous vegetables was, “possibly“. This is dangerous scepticism from Dave. Regardless of how plausible he thinks his hypotheses are, the independent causal role of LDL is beyond reasonable scientific doubt and adding confusion to this message is sending a potentially harmful message to his following. Dave already acknowledges that his followers and LMHRs generally follow dietary practices (high red meat and butter intake) that increase LDL unnecessarily, so it’s unreasonable to spew doubt on the LDL consensus and the nutritional recommendations that follow. Even if Dave holds a small degree of doubt for LDL causality, then fine, he is perfectly entitled, but he should still actively encourage his followers and especially those with high LDL-C to make lifestyle changes to lower it based on current knowledge. An honest and caring person wouldn’t think twice about that.
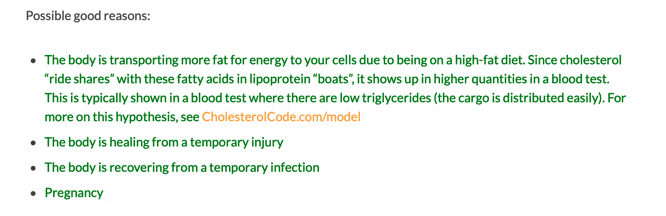
Even Dave’s basic logical arguments have no legs to stand on. On his website, he implies that the lipid energy model may explain non-pathological LDL-C increases because this is a “good” process. In fact, he speculates 4 “good” reasons for high LDL-C. The first three are temporary injury, infection, and pregnancy (only relevant to short-term fluctuations in LDL-C) and the last one is increased fat trafficking, i.e. the lipid energy model. But as we’ve covered, the lipid energy model doesn’t grant safety just because it can be explained in a way that Dave finds interesting. Whether or not a change in LDL-C has an interesting physiological explanation says nothing about the atherogenicity of LDL particles. Even if these lipoprotein changes are necessary for short-term survival and have a purpose such as fat trafficking, that doesn’t mean it isn’t detrimental to CVD risk over the long term. This is a basic logical error.
If we take the Framingham Offspring analysis that Dave cites, you will also see that the group with the lowest CVD of all had LDL < 100mg/dL with high HDL-C and low TG; a 0.1 lower odds ratio than LDL-C >100 mg/dL in the same conditions. You will also find that relative to each reference group of low HDL-C and high TG, LDL-C above the cut-off point for that reference group always led to higher CVD risk compared to LDL-C below the cut-off point for that reference group.
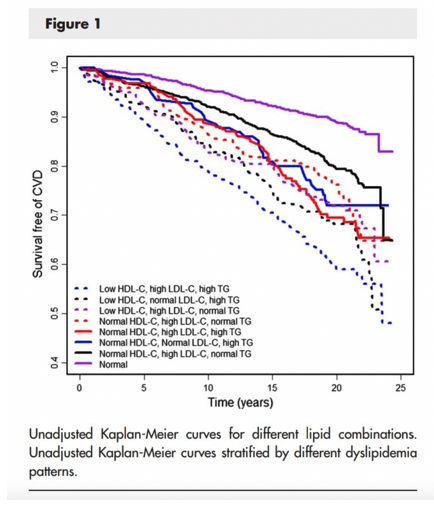
A different analysis of the same Framingham Offspring data by Andersson et al. [12] helps to solidify this point. The graph below shows CVD hazard ratios when participants are modelled into 8 levels of all the possible combinations of LDL-C, HDL-C and TG. And the authors of the analysis concluded that, “Aside from isolated hypertriglyceridemia, low levels of HDL-C, high levels of LDL-C, and high levels of TG in any combination were associated with increased risk of CVD”.
Likewise, if we take Daves’s second cited human outcome study, the same conclusion is reached. High LDL-C (>170 mg/dL) was linked with a 30% higher odds ratio for IHD incidence when compared to low LDL-C (< 170mg/dL), even in the context of low TG and high HDL-C, and even when the LDL-C difference between the high and low LDL-C groups was only 19.33mg. The result was not statistically significant, but the confidence interval (0.98-1.72) was highly suggestive of higher IHD risk with higher LDL-C as expected with inherent LDL atherogenicity.
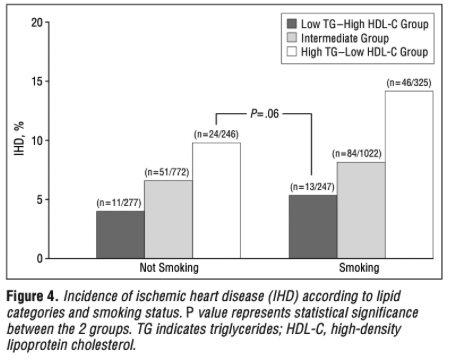
 Dave might just point to the lack of statistical significance to make a point, but this is expected when the absolute incidence rate is extremely low (due to short follow-up relative to participant age). There is bound to be a great deal of outcome variability when this happens, as reflected by the very wide confidence intervals (low confidence in effect) throughout the entire dataset. This becomes clear when we see the same graph that Dave presents for this study, but instead of LDL-C in the context of HDL-C and TG, it uses smoking status in the same context. And in the same manner as LDL-C, the very limited incidence rate actually makes it appear as though high HDL-C and low TG protect against the harms of smoking. Clearly this is not a position that any sane person would take, and so there is no reason to treat LDL-C differently.
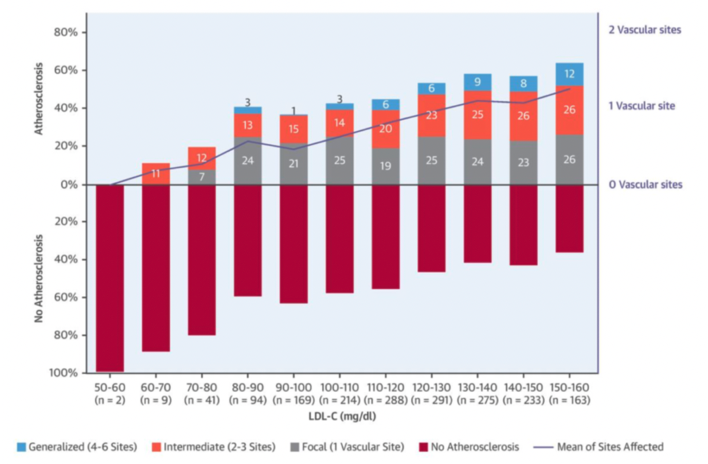
As a final straw, I will add a study that’s not mentioned on Daves site, which is the Early Subclinical Atherosclerosis Study by Fernandez-Friera et al. This novel study analysed subclinical atherosclerosis (plaque or coronary artery calcification) in 1,779 middle-aged adults that didn’t have other conventional CVD risk factors. Risk factor freedom was defined as not smoking, untreated blood pressure < 140/90 mmHg, fasting glucose < 126 mg/dl, total cholesterol < 240mg/dl, LDL-C < 160 mg/dl, and high-density lipoprotein cholesterol (HDL-C) ≥ 40 mg/dl. The results showed that, despite the absence of conventional CVD risk factors, LDL-C was still independently associated with the presence and extent of early atherosclerotic progression, as measured by 2D vascular ultrasound and non-contrast cardiac computed tomography. Such results led the study authors to conclude that, “LDL-C, even at levels currently considered normal, is independently associated with the presence and extent of early systemic atherosclerosis in the absence of major CVRFs. These findings support more effective LDL-C lowering for primordial prevention, even in individuals conventionally considered at optimal risk”. One of the reasons I add this study to the mix is that the previous studies commonly cited by Dave have a cut-off point of LDL <100mg/dL and <170mg/dL, and there is no appreciation for LDL-C values below these cut-off points. As this study supports, though, the benefit to LDL-C lowering for reducing atherosclerotic progression is apparent even in healthy populations.
So, while the magnitude of CVD risk is mediated by the levels of other risk factors due to the multifactorial nature of the disease, including the levels of other lipoproteins, the reduction in CVD risk with lower LDL-C is always present. There are no known exceptions to this rule. Dave likes to state that he is “cautiously optimistic” and that he has a “leaning” that high LDL-C is not an issue in some contexts, but this is simply wordplay. The evidence doesn’t support this. Matt Madore has already written an extensive article on LDL denialists such as Uffe Ravnskov, and Dave can be added to this pool.
Putting HDL and TG into Context
Since you’ve made it this far and I like writing, I may as well quickly put HDL and TG into context. When we understand how HDL and TG differ from LDL regarding their (lack of) causal effects in CVD, it’s easier to comprehend why LDL must be treated differently. Because while we know that LDL is an independent causal CVD risk factor, the same cannot be said for HDL or TG.
To first touch on TG’s, although they’re very much related to CVD, they are best defined as a systems biomarker rather than a causal factor. Much like Daves lipid energy model suggests, TG are contained within the various circulating lipids and, in turn, measuring TG provides a good proxy measure of blood lipids, especially ApoB containing lipids such as LDL. Thus, despite TG being linked with CVD in unadjusted analyses, independent associations of TG on CVD are lost once adjusted for ApoB, or surrogate measures of ApoB such as non-HDL-C. This is supported by a recent MR analysis evaluating the associations of genetic scores composed of TG-lowering variants (in the LPL gene) and LDL-C–lowering variants (in the LDLR gene). The risk of CVD events was analysed among 63 cohort or case-control studies, totalling 654,783 participants and 91,129 cases of CHD. The primary result was that genome-wide, significant associations between TG and CVD risk become statistically nonsignificant after adjustment for ApoB. Very similar results were found in a multivariable MR analysis by Richardson et al. of the vast UK Biobank data pool containing near half a million participants. Again, after taking into account the effects of apoB, the relationships of other lipid-related entities with the risk of CHD become nonsignificant, whereas the relationship of apoB with the risk of CHD is robust enough to survive the statistical adjustments for other traits.
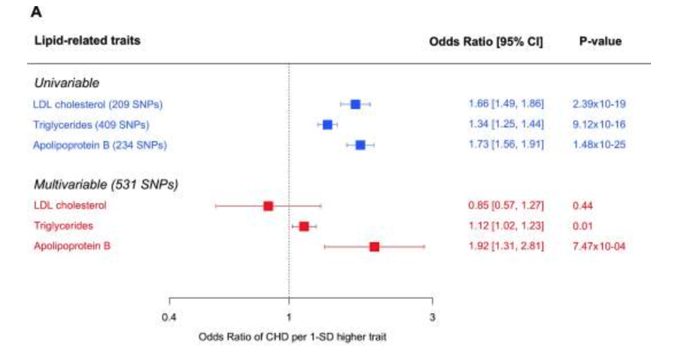
As the authors of the latter study suggest, “it is the number of atherogenic lipoprotein particles indexed by apolipoprotein B rather than the amount of circulating cholesterol or TG per se that is the important driver of CHD. In other words, changes in cholesterol or TG that are not accompanied by commensurate changes in apolipoprotein B may not lead to altered risks of CHD”. This is not to say that lowering TG has no independent relationship to CVD risk, as meta-regression of TG-lowering RCT trials find that lowering TG is associated with a lower risk of CVD, but it is to say that the benefit to CVD risk is mostly as a result of ApoB-lowering (including LDL-lowering). This is why the benefit of TG-lowering from these RCT trials is blunted when adjusted for LDL-C, as LDL-C tracks loosely for ApoB. There may be some residual risk for TG even after adjustment for LDL-C, but this is likely the residual risk posed by other ApoB lipids such as VLDL that aren’t accounted for in adjustments for only LDL.
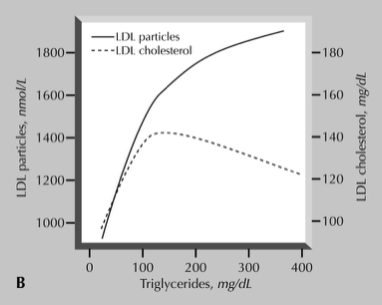
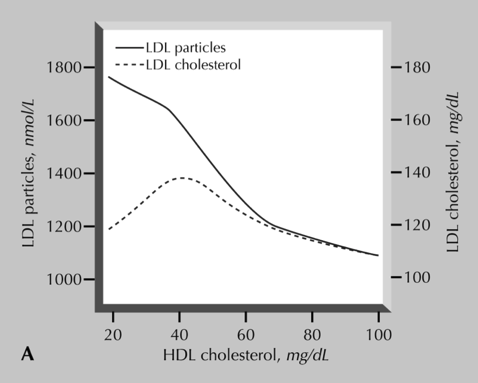
We know that LDL-C is not always a perfect proxy for ApoB, and this is actually seen in the Framingham Offspring data. In fact, TG actually tracks better with LDL particle number than LDL-C does, which can make it a better correlate for ApoB. This explains why TG also makes for a great predictor of CVD, despite having no well-established causal role in the disease.
Similar arguments that apply to TG also apply to HDL, in that it lacks a well-established causal role in CVD based on the current evidence base. Although epidemiological data consistently suggests a protective effect of higher HDL, neither intervention studies nor Mendelian randomisation studies suggest a causal role for HDL with regard to CVD. In the same MR analysis of the UK Biobank data by Richardson et al., mentioned previously, the protective effect of HDL-C is once again lost after multivariable adjustment.
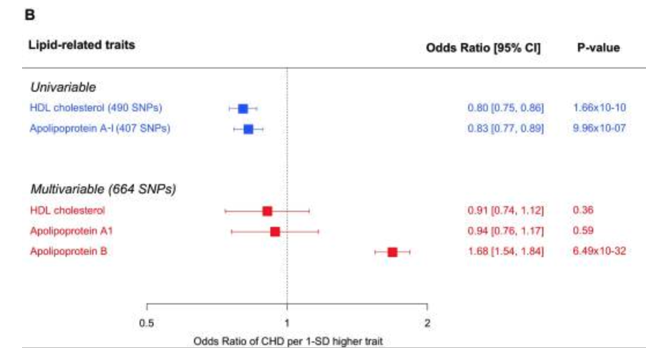
The same story for TG applies again to HDL, then. Reduced HDL-C is a CVD risk factor, but only because it is a correlate for increased apoB: too many LDLs & remnants. The same analysis of the Framingham Offspring study support this. The authors of the study state, “Further analysis indicated that increased TG’s and decreased HDL cholesterol were significantly associated with a “disconnect” between LDL cholesterol and LDL particle number”. Therefore, much of the CVD risk associated with low HDL-C is explained by a concomitant increase in ApoB. This helps to highlight why the primary goal of CVD therapy is not to increase HDL-C, but rather to lower apoB. The lack of benefit from HDL-C raising interventions in RCT’s, such as torcetrapib and niacin only supports this further.
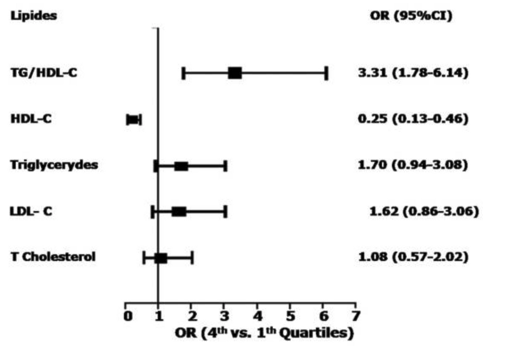
Taking all the evidence into account collectively, HDL and TG appear to be CVD risk markers as opposed to risk mediators. This doesn’t label them useless as part of a CVD management framework—far from it—but this differential must be emphasised in discussions surrounding LMHR and whether high LDL is “protected” in the context of high HDL-C and low TG. The evidence-based position is not that TG or HDL-C have strong causal roles in CVD, but rather that a lower TG/HDL ratio is a reliable disease correlate and helps to establish an individual’s overall risk of CVD. This might relate to what CVD risk category LMHRs fall under, but it shouldn’t be used to question the inherent atherogenicity of LDL. I say this as a strong proponent of using the TG/HDL as a reliable CVD risk predictor tool. There’s now a good pool of data suggesting the TG/HDL-C ratio has the strongest association with CVD incidence even when compared to lipid variables (shown below; although ApoB not considered). Plus, given that lower TG/HDL strongly associate with a number of other disease states, such as non-alcoholic fatty liver disease, diabetes and metabolic syndrome, this lipid ratio is great marker of ill-health, indicating the progression of other disease states that are interlinked with CVD pathology, even when TG and HDL themselves are not.
Final Thoughts
LDL is an independent causal risk factor in CVD and neither the ketogenic diet nor one’s theories about metabolic health change this fact. Although Dave continues to state that he’s “cautiously optimistic” about LDL atherogenicity in the context of good metabolic health, this is based on hope rather than evidence. And while Dave likes to perpetuate the narrative of “we don’t know” and “we need more studies”, the reality is that science revolves around the assessment of probabilities in order to reach the most likely conclusion that can be used to guide nutrition recommendations. Saying that “we don’t know” implies that we have no indication, no knowledge, and no logical basis to comment on the likelihood that LMHRs are at a higher CVD risk than if they were to lower their LDL. But we do. Every line of evidence points toward higher LDL increasing the risk of CVD in every known context, and we shouldn’t presume LMHRs are an exception. For this reason, we (including Dave) should be open and honest regarding the risk that LMHRs are posing to themselves.
If you are a fan of our work here, please consider donating to the site to support the work of our authors using this link or going through our Donate page on the site navigator. Also, please sign up for our email list below (we do not spam!).


