

The prevalence of obesity and chronic disease is at an all-time high. In turn, many discussions about these issues are trying to tease out the underlying cause(s) of the issue, what or who is to blame, and how we, as a society, might possibly get ourselves out of this unfortunate mess. From a nutrition perspective, almost everything has been blamed for the obesity epidemic and its related issues: fat, carbohydrate, protein, food processing, seed oils, meat, and harmful agricultural practices. You name it, it’s been said, all with varying degrees of truth (usually little to none).
In recent years, however, the attention and blame for public health issues has shifted to the dietary guidelines more generally. This is not only evidenced by a spike in dietary guideline criticisms across social media platforms, but also by criticisms found in the peer-reviewed literature. In fact, Nutrition Coalition wrote an article outlining a long list of medical doctors, journal editors, university lecturers, and science journalists that have openly criticised the dietary guidelines. A quote in one of these criticisms, by Keir Watson at the Rosemary Cottage Clinic, summarises the general argument quite well: “With such clear evidence of the importance of diet, and the failure of 30 years of the standard advice, most governments have dug in their heals, doubled down and simply shouted their message louder, much to the dismay of nutritional researchers many of whom were starting to believe that the dietary guidelines might actually be contributing to the rising tide of chronic disease they were designed to address”. So as you can see, the persistent argument is simply that if the dietary guidelines were evidently helpful, then we wouldn’t be in the middle of such a health crisis. But given that we are, the dietary guidelines must therefore be unhelpful. Few people criticising the guidelines have actually just labelled them more bluntly as “wrong“.
In any case, as a nutritionist myself, and someone who cares much for scientific rigor in the field of nutrition, I feel there is a need for a deep-dive article that systematically breaks down these criticisms and puts them into context. The main criticisms that I will be directly addressing are the following:
- “The dietary guidelines are different in countries with low rates of obesity and chronic disease”
- “The dietary guidelines have worsened obesity and chronic disease rates”
- “Dietary guidelines lack supporting evidence for improving public health”
- “Dietary guidelines are not appropriate for treating chronic diseases”
- “The Dietary Guidelines never change, are formulated by bad scientists, and are not based on the best evidence“
“The dietary guidelines are different in countries with low rates of obesity and chronic disease”
With obesity and chronic disease rates varying so dramatically between countries, you might expect the dietary guidelines of each country to be wildly different. But this isn’t the case. Using country-specific information provided by The Food and Agriculture Organization of the United Nations, it’s clear that dietary guidelines are relatively consistent around the world. Of course, each country provides a unique spin when visually displaying their dietary guidelines (plate models, food pagodas, text-only), and there is some expected variance between cultures, but the overarching nutrition messages are almost identical: prioritise vegetables, fruit, whole grains, lean meats, fish, dairy, legumes, oils, nuts and seeds. There is really not much else to say on this matter other than to check country-specific dietary guidelines for yourself and note the similarities. If the dietary guidelines were inherently harmful, then why would some countries (Japan and Bangladesh) implementing them have an obesity rate under 5% and others (United States and the United Kingdom) have an obesity rate between 30 – 40%?

“The dietary guidelines have worsened obesity and chronic disease rates”
Another argument to try and vilify the dietary guidelines is a simple timeline comparison between the introduction of the dietary guidelines (1980 and beyond) and the rates of country-specific obesity since then. As the rates of obesity appear to increase around the time the dietary guidelines were introduced, some people are quick to point the finger at the dietary guidelines being the cause of the issue. There are many graphs that I can use to illustrate this argument, as they are widespread on social media, but I’ll just use the graph below as one example.
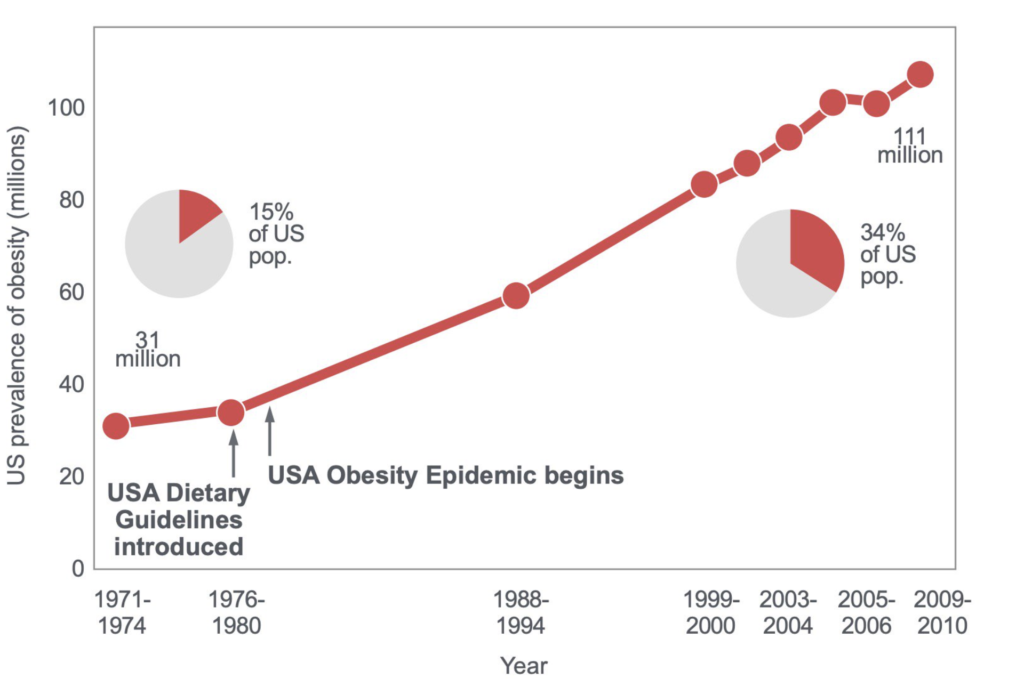 Firstly, I want to emphasise the point that we must be extremely cautious of timeline comparisons as they are extremely susceptible to post-hoc fallacy: since event Y followed event X, event Y must have been caused by event X. These types of sweeping observations are quite literally the worst type of observational evidence that anyone can reference as they are susceptible to endless amounts of confounding. We should acknowledge that so much changed in the economy around the time the dietary guidelines were introduced–from socioeconomical issues to changes in food manufacturing– that it’s unwise to claim they’re the reason for rising health problems without more supporting evidence.
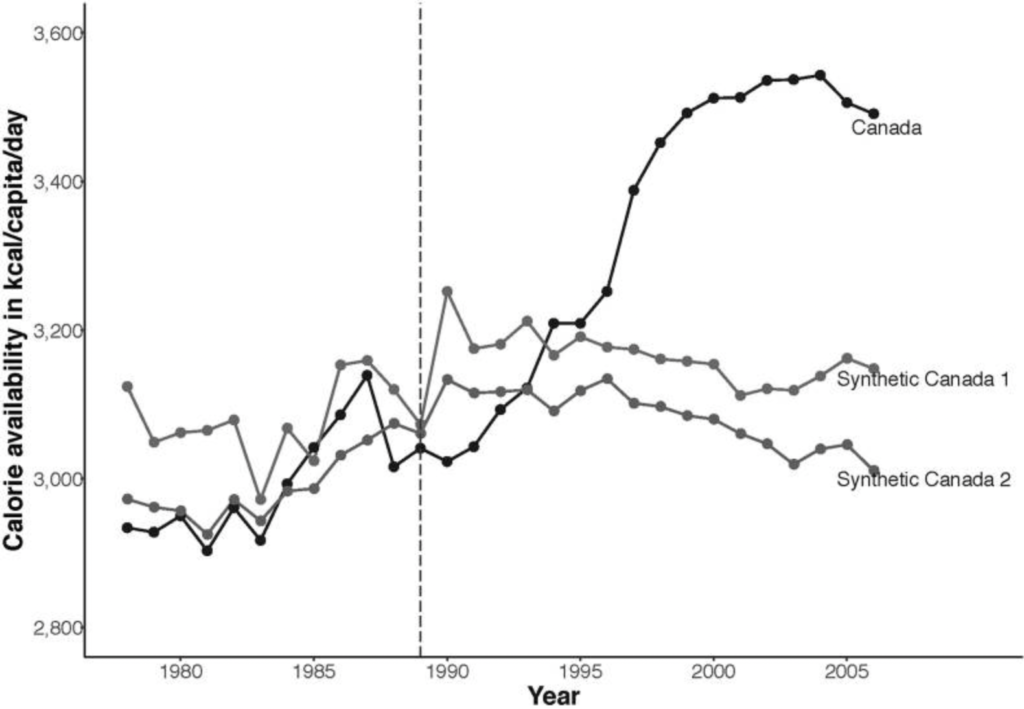
However, even if we are to go by timeline comparisons as a means of argumentation, there are simply more plausible explanations for the deleterious changes in body weight and health since 1980 than a set of dietary guidelines created to promote health based on the best available scientific evidence. To highlight just one of the more plausible factors, data shows there was an accelerated change in the food supply from the 1960s onward, well before the introduction of dietary guidelines. Economic development resulted in increased consumer buying power alongside a reduced cost of food, all while the food industry was increasing the accessibility of more energy-dense foods. A good example to showcase the influence of economic factors comes from Barlow et al. who looked at Canada’s food energy availability trend before and after the multi-billion dollar Canada–U.S. Free Trade Agreement (CUSFTA) in 1989. The data from Canada was compared to Denmark, the Netherlands, and New Zealand, all of which had parallel trends in food energy availability before 1989 but did not then have such a substantial food industry investment. This allowed for the actual events in Canada to be compared against ‘Synthetic Canada’s’ based on similar comparison countries. The results were striking. To quote the authors themselves, “In Canada, calorie availability rose from 3,028.5 kcal/capita/day in 1988 just before CUSFTA was implemented to 3,491.0 kcal/capita/day in 2006. Thus, calorie availability was on average 343.1 (95% CI = 294.3, 391.9) kcal/capita/day higher in Canada after CUSFTA compared with before CUSFTA”. Importantly for this discussion, the rise in caloric availability in Canada was also estimated to lead to an average weight gain of 1.8 – 9.3 kg for men and 2.0 – 12.2 kg for women aged 40 years, depending on their assumed pass-through from availability to intake. This estimated weight gain is consistent with the actual observed increases in obesity rates among Canadian adults, rising from 5.6% in 1985 to 14.7% in 2003.
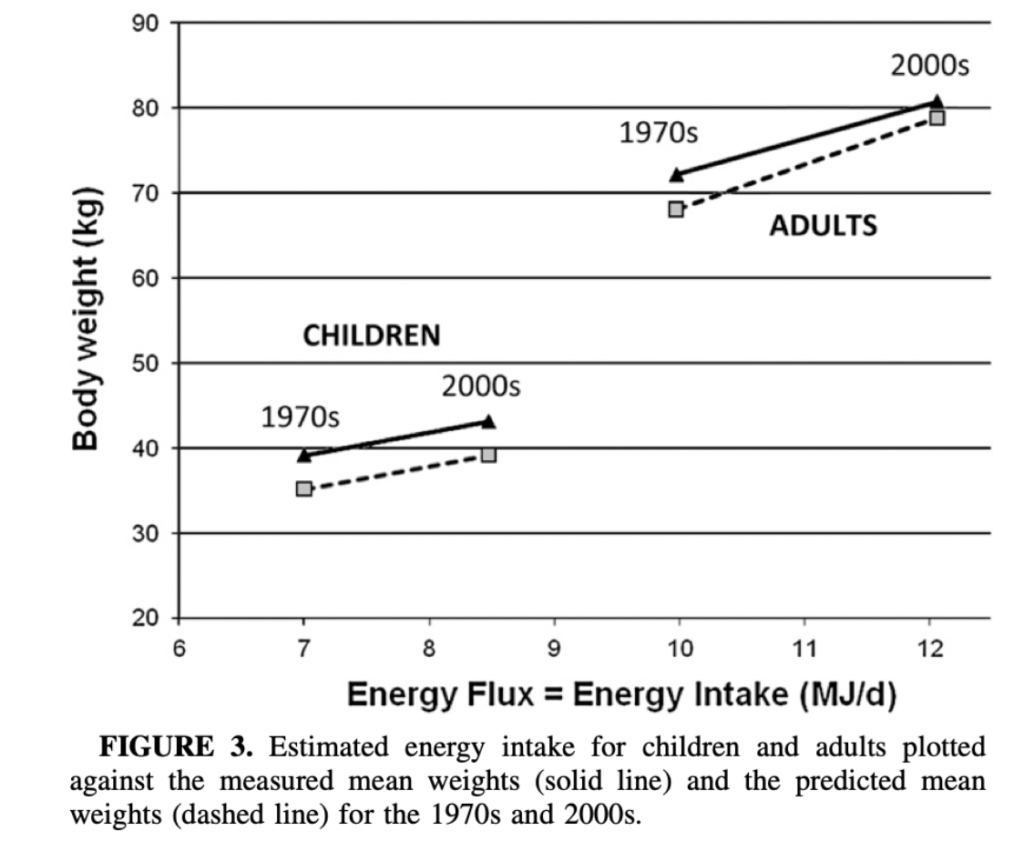
 Similar to the data from Canada, Swinburn et al. published a paper in 2009 to clarify that increased food energy supply is more than sufficient to explain the epidemic of obesity in the United States (US). These researchers opted to analyse food energy availability in the food supply as a proxy for energy intake, and then model it against USDA food supply data to account for the loss of food (via spoilage and other means). This allows one to estimate changes in energy supply per capita. Then, using data from The National Health and Nutrition Examination Surveys (NHANES), changes in food energy supply could be compare against mean body weight changes from the 1970s (1971–1976) to the 2000s (1999–2002). The findings were that, on average, food energy availability per capita in the US had increased by 500 – 700kcal per day from the 1970s to the 2000s. Also, when the changes in food energy availability were modelled against body weight changes, this factor alone appeared to be practically sufficient to explain the average change in population bodyweight. In other words, increases in food energy availability largely explain the obesity crisis. Some people might contend this idea, or the methods of this study specifically, for example, but it’s worth noting that the validity of the studies methodology is confirmed by the USDA. They state that food supply data provides a useful indicator of consumption trends over time as any errors are likely to be systematic, i.e. it’s the contrast in energy availability changes over time that matters rather than accurate measures of absolute values.
Since this study, Vandevijvere et al. performed a more comprehensive global analysis that illustrates the same effect across countries. They collected data from global databases, national health surveys and peer-reviewed studies to assess body weight changes in 69 countries from 1971 – 2010, before using experimentally validated models to compare body weight changes to country-specific food energy supply data retrieved from the FAO (balancing local production, country-wide stocks and imports with exports, agricultural use for livestock, seed and some components of waste). For 56 of the included countries (81% of the total pool), both food energy supply and body weight increased between the survey pairs. And for 45 of these 56 countries (80%), the increase in food energy supply was more than sufficient to explain the increase in average body weight over time. As a test for statistical significance was also incorporated into the analysis, the researchers also noted a significant correlation (P=0.011) between the change in food energy supply and the change in population average bodyweight among all countries.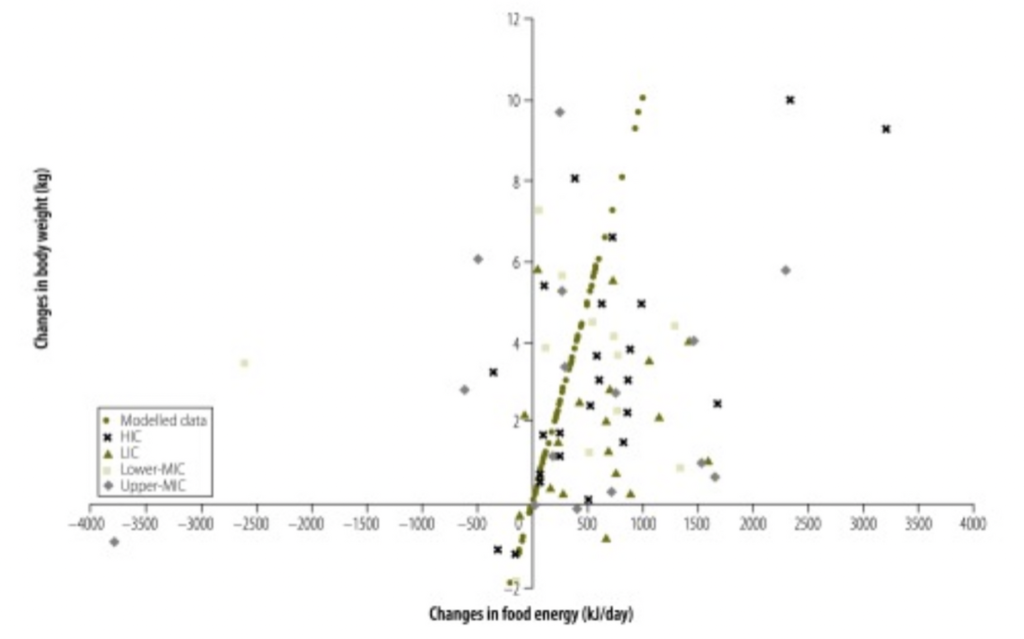 If we are now to move the conversation onto chronic diseases, particularly the world’s number one killer, cardiovascular disease (CVD), we might also assume that increases in body weight also explain the presumed increase in heart disease since the introduction of the dietary guidelines. But this isn’t the case. In fact, although coronary heart disease rates changed dramatically in the 20th century and peaked before the dietary guidelines in 1968, age-adjusted rates of coronary heart disease are now 50% of these peak rates. That is to say, then, that heart disease rates have indeed declined since the dietary guidelines were introduced. People criticising the dietary guidelines tend to be ignorant to this point. If not, though, they often try to argue that the improvement in medical treatment since the 1960s is hiding the true deleterious effect of the guidelines. However, neither position is supported by scientific evidence.
While explanations for heart disease reductions during this time period are hard to tease out, given the increases in some CVD risk factors (obesity, diabetes) and reduction in others (blood pressure, smoking, total cholesterol), it has been done. Ford et al. used validated mortality models to examine the contributions of various factors to the changes in coronary heart disease mortality rates among U.S. adults. The model itself is complex, but the researchers essentially used time- and age- relevant data on the U.S. population, and mortality rates from the National Vital Statistics System of the National Center for Health Statistics, to model the number of expected heart disease deaths in 2000 if the mortality rates in 1980 remained unchanged (accounting for population ageing). Then, by subtracting the actual number of heart disease deaths observed in 2000 from the number of expected deaths from 1980, a difference in heart disease events was calculated, for which differences in CVD risk factors from 1980 to 2000 would have to explain. The researchers then used regression coefficients and relative risks obtained from meta-analyses for each risk factor to weight the relative contribution of each risk factor to the measured difference in expected versus actual heart disease deaths. Cool, right? By doing so, changes in medical treatments accounted for only ~47% of the reductions in CVD-related deaths from 1980 to 2000, with other risk factor changes accounting for ~44%. Decreases in total cholesterol concentration and systolic blood pressure from dietary changes and smoking prevalence were thought to be strong contributing factors. Needless to say, then, these are insights that refute claims that heart disease rates have increased since the introduction of the dietary guidelines, or that only medical intervention has positively influenced heart disease mortality. We might warrant caution in the interpretation of the results here, given the inherent complexities in such modelling analyses and the numerous, unrelated sources of information used for data gathering, but the results speak for themselves. In addition, there is consistency with results from other countries using slightly different modelling approaches, such as Finland [9], Scotland [10], New Zealand [11], England and Wales [12]. This is extremely reassuring.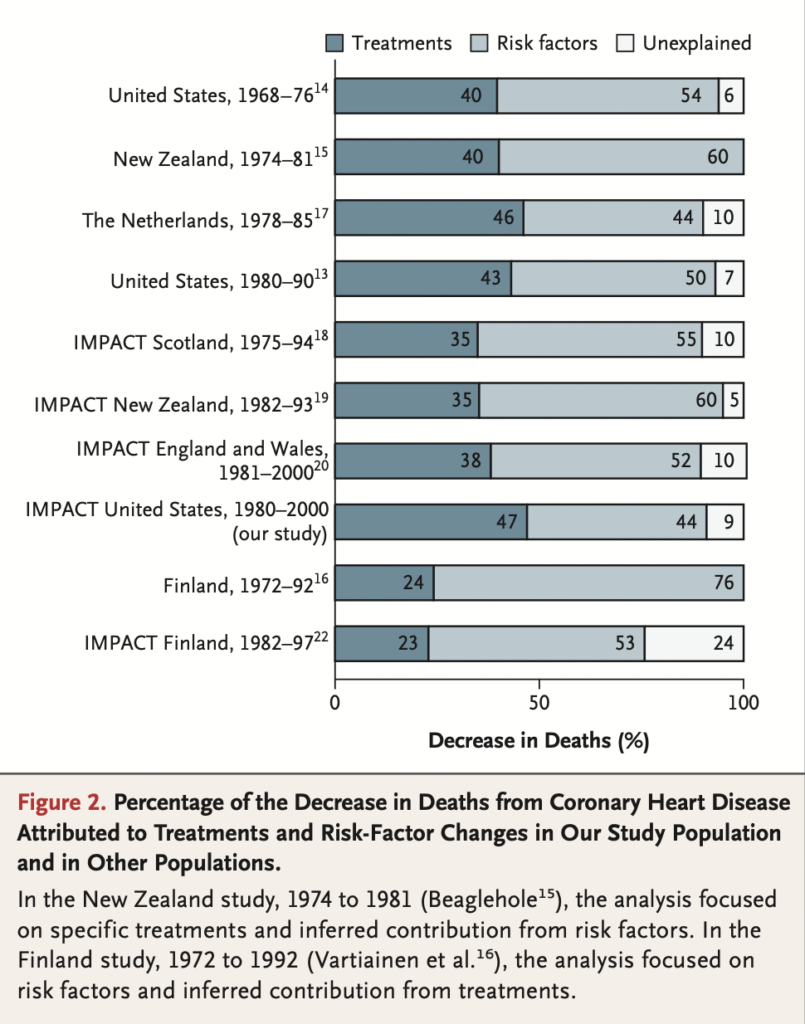
“Dietary guidelines lack supporting evidence for improving public health”
To re-emphasise an earlier point, timeline comparisons are highly susceptible to confounding. Thus, to better understand the efficacy of the dietary guidelines, it can be helpful to look at prospective studies analysing how dietary guideline adherence associates with the rates of obesity and chronic diseases. I do not believe it’s necessary to do so in order to support the dietary guideline’s effectiveness–the dietary guidelines are simply representing a collection of individual nutrition recommendations that have each been validated independently–but this line of research does closely relate to the question we’re trying to answer.
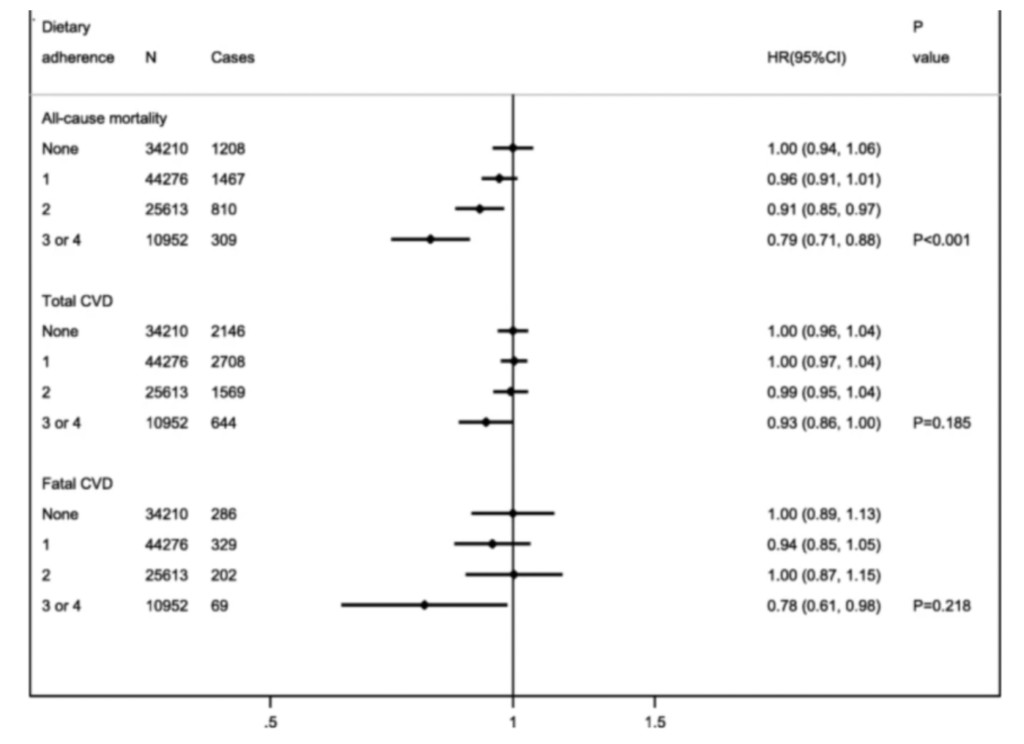
Possibly the most comprehensive study with the best exclusion criteria, and one of the only analyses that strictly tests the effects of meeting each dietary guideline versus not, is a UK Biobank prospective cohort study from Kebbe et al. The UK Biobank is a national cohort involving 502,536 participants, but for this particular analysis, the Biobank pool was refined by exclusion of participants with insufficient dietary intake data, the presence of CVD prior to baseline or the last dietary assessment, or if energy intakes were reported as implausible. This still left a sizeable total of 115,051 Biobank participants for analysis, with an average follow-up time of 10.6 years for total CVD and 11.2 years for fatal CVD and all-cause mortality. The main exposure was the strict achievement of dietary goals that the dietary guidelines recommend: ≤ 10% total energy from saturated fat, ≤ 10% total energy from free sugars, ≥ 25 g/day dietary fibre, and ≥ 5 servings of fruits and vegetables per day. The primary outcome analysis was based on the number of these dietary recommendations that participants met (out of a total of 4, using 0 as the reference category). The result was that there was an estimated 21% reduction in all-cause mortality with increasing adherence to dietary guideline recommendations, after multivariable adjustment accounted for a long list of confounders. A statistically significant trend was not found for adherence and CVD incidence and mortality; however, adherence to 3–4 guidelines was associated with significantly lower CVD mortality than the reference category.
 The overall benefit in achieving more of the dietary guidelines, particularly when achieving 3-4 of those analysed here, is an important finding that certainly supports the use of dietary guidelines at a population level. The need to try and achieve as many guidelines as possible is also highlighted in the secondary analysis which examined the weight of effect from each individual recommendation by way of mutual adjustment. This analysis showed that primary outcome associations were not clearly explained by any single recommendation and it was actually the cumulative effect from all interventions that explained the overall benefit(s). I can’t help but question why a low sodium recommendation was not part of this study’s analysis, as this would likely have been another significant variable, particularly for analysing CVD risk, but the results still speak for themselves regardless here.
However, one point to touch on about the UK Biobank analysis was that the classification of the exposure was set to binary groups (strictly meeting versus not meeting each recommendation), which invariably reduces the precision of the dietary estimates compared to other methods (e.g. dietary scores). Binary groups are not the best method for assessing trends with increasing levels of dietary adherence. Ideally, for this purpose at least, dietary guidelines are tested by way of dietary indexes, which are a composite indicator of diet quality and adherence to an a priori set of recommendations reflected by a single score. A compliance score for each component is typically scored out of 5 or 10, and then all component scores are summed to give an overall diet score out of either 50 or 100 Higher scores reflect better diet quality as measured by adherence to the dietary guidelines. Once dietary index scores are analysed, they are then modelled with prospective outcome data, such as rates of mortality.
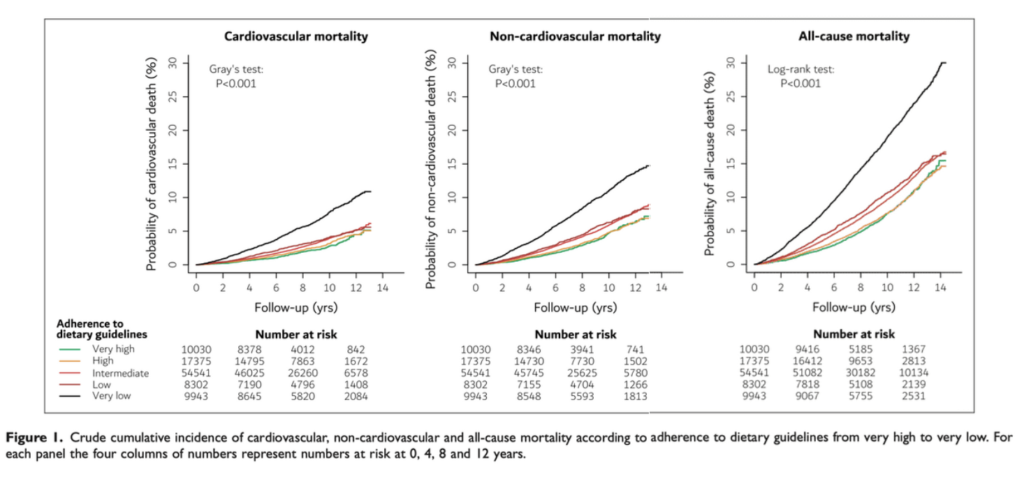
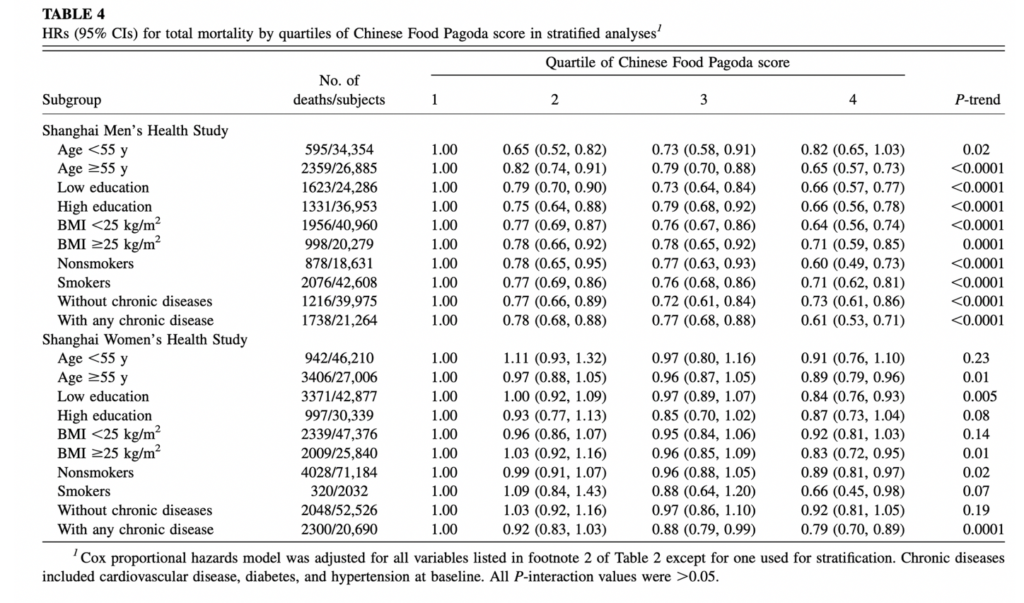
A couple of large studies incorporate levels of adherence really well, too, such as The Copenhagen General Population Study (abbreviated CGP) and a combined analysis of the Shanghai Men’s and Women’s Health Study (abbreviated SMWH). SMWH used dietary scores as described previously, whereas the former used a similar validated approach. To date, these are the largest relevant studies that make use of grouping participants into levels of adherence. Both of these studies recruited over 100,000 adults, and each study had 10-15 years of follow-up analysis (almost 1 million person-years of follow-up). All participants’ diets were assessed at baseline by an FFQ focused on the key foods mentioned in their countries’ respective dietary guidelines, after which participants were grouped into 4 (SMWH) or 5 (CGP) adherence categories ranging from very low to very high. And by way of Cox regression models, both studies found that all-cause mortality (CGP, 43% lower; SMWH, 13.- 33% lower) and cardiovascular mortality (CGP, 30% lower; SMWH, 12 – 46% lower) were lower in groups that adhered closer to the dietary guidelines. Also, other than for women in the SMWH study, both studies showed a statistically significant trend in improvement for all outcomes with increasing levels of dietary guideline adherence. This is a critical point considering that neither study actually reached particularly high dietary scores or levels of agreement, even in the highest quartile or quintile, which indicates there was still much room for dietary improvement even in the “high adherence” groups.
Just to make it known, too, these are not the only studies showing the benefit of greater dietary guideline adherence; they are just the ones with the most statistical power if the pool of relevant studies were to be meta-analytically summated. Very similar benefits have been found in smaller cohorts (ranging from 1,000 to 10,000 individuals) in Australia [17], Finland, Italy [18], and the Netherlands [18] [19]. Therefore, the overall evidence strongly suggests that, even after multivariable adjustment, greater adherence to the dietary guidelines reduces the risk of all-cause and cause-specific mortalities. This position should not be anywhere near as debated as it appears to be.
The Elephant in the Room
Ok, so now that we have clarified the dietary guidelines are not the cause of worsening health issues, we should address the obvious question. That is, why are there still glaringly obvious health issues if the dietary guidelines promote good health? I think there is both a simple and complex answer to this. Simple answer – terrible adherence to healthy eating patterns. Complex answer – the economy and the current food system is not promotive of healthy eating patterns.
I honestly don’t believe the extent of just how awful the average person’s diet is can be emphasised enough in these types of discussions. It’s not as if some people just don’t stick to one or two recommendations in the dietary guidelines and their health is poor as a result. We’re literally talking about large groups of people that struggle to achieve even a single healthy eating recommendation. Examples below:
- In the UK Biobank Study that we discussed previously, nearly one third (29.7%) of participants didn’t meet any dietary recommendations; 38.5% of participants met one recommendation; 22.3% met two recommendations; 9.5% met three or four recommendations.
- In another analysis of UK cohorts looking at adherence to food-based recommendations based on the Eatwell plate, only a third of participants adhered to 5 of the 9 primary recommendations, and less than 0.1% of the sample adhered to all nine food recommendations. So, if achieving all 9 of the primary recommendations is to be labelled as perfect adherence, then pretty much no one perfectly adheres to the dietary guidelines, at least in the UK.
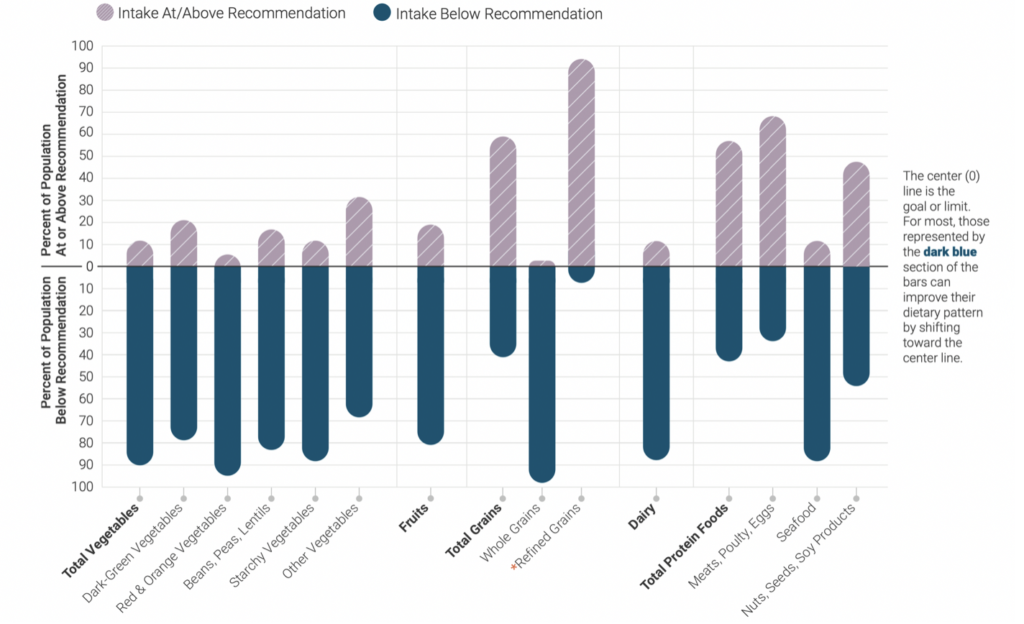
- In the U.S, the latest dietary guidelines report provides a nice illustration using data from the Analysis of What We Eat in America, NHANES 2013-2016. More than 80% of the U.S. population were eating below the recommendation for vegetables, whole grains, fruits, dairy, and seafood. In contrast, between 60% – 90% of the population consumed above the recommendation for meat, poultry and eggs, and refined grains. A review of dietary guideline adherence in the U.S. bluntly states, “nearly the entire U.S. population consumes a diet that is not on par with recommendations”.
People may look at the statistics above and use them to argue against the appropriateness of the dietary guidelines – “what use are they if people can’t stick to them?” – but I think we need to be honest and understand that such poor adherence is little to do with the guideline themselves. Unfortunately, influencing human behaviour is not as simple as just telling people what to do and hoping they do it. There are a plethora of external and societal barriers for change when it comes to implementing any healthy lifestyle or behavioural recommendation. This requires another deep dive article to understand the vast complexities here, but let’s just say that high rates of poverty, lack of education, a general increase in life stressors, and a shift in microenvironmental influencers (marketing and food convenience) have all influenced eating behaviours dramatically over the last decades. Of course, we also saw the general increase in food energy availability from a previous section of this article which is a major discussion point too. If we truly want to fix our eating issues as a society, dietary guidelines are not going to cut it regardless of what foods they promote. Dietary guidelines aren’t a panacea for our health problems. As stated by Vandevijvere et al., “Action needs to be directed at the main drivers [government and food industry] of the epidemic to meet the global target of halting the rise in obesity by 2025”.
Do The Guidelines Hold Up to Intervention?
I can already hear some people in the comments… but where are the RCTs to validate the guidelines? I find this question particularly amusing because, while there do happen to be a few RCTs that test versions of the dietary guidelines as an intervention, the questionee shows ignorance simply by asking the question. The main reasons why are twofold:
- The dietary guidelines are not a rigid protocol as with other “diets”. Instead, they are a collection of primary recommendations that have each been validated with strong evidence (including RCTs) to justify their inclusion. These recommendations are open to change every 5 years when the guidelines are updated provided the underpinning evidence base changes. Further, the dietary guidelines are, as the name suggests, a guide, not a rule. This guide is not even intended for a public audience directly. The dietary guidelines target groups or individuals involved in distributing nutrition information to the public (federal, local, and professional use) and there is a consistent emphasis on individual personalisation throughout the guidelines, stating “Medical and nutrition professionals may use or adapt the Dietary Guidelines to encourage their patients or clients to follow a healthy dietary pattern” and they “explicitly emphasize that a healthy dietary pattern is not a rigid prescription. Rather, the Guidelines are a customizable framework of core elements within which individuals make tailored and affordable choices that meet their personal, cultural, and traditional preferences“.
- The endpoint of the information in the dietary guidelines text is healthy and at-risk individuals. Although actual “diets” with very similar principles to the dietary guidelines (such as the Mediterranean Diet and DASH) have many RCTs for their benefit on health outcomes, they are usually conducted on a moderate-high risk population to restore good health. The dietary guidelines, however, don’t aim to restore anything; they aim to prevent the need to restore. RCTs on health outcomes can still be done effectively on paper with healthy populations only, but these long-term trials are rarely feasible and, especially considering the known issues with adherence to the dietary guidelines, I’m not even sure an RCT that attempts to do so effectively will be very successful. It will most likely end up with very similar considerations for confounding that prospective cohort studies do.
This being said, there is a very small pool of randomised controlled trials—literally 3 relevant trials to my knowledge—that have tried to directly look at how the dietary guidelines influence markers of health such as blood lipids, blood pressure, and glycemic and inflammatory markers. The outcome variables here are not hard endpoints but can still help to indicate how a diet may influence hard endpoints if ever tested. So on paper, these RCTs sound rather interesting and informative. The problem is, they aren’t. There are many issues with this relevant pool of RCTs that make it really difficult to draw any strong conclusions regarding the effectiveness of the guidelines as an intervention. However, as these issues make for a good nutrition science brainteaser, I will still highlight and discuss them.
To start, an RCT on the dietary guidelines by Krishnan et al. used an indefensible version of the dietary guidelines. In the supplementary data, a sample log sheet for one day of the dietary guideline intervention was provided. It included foods such as table sugar, cream, 10% fat beef, fruit juices, smoothies, condiments, and chocolate tarts – all in one day. The dietary guideline intervention actually trebled the participant’s absolute added sugar intake compared to baseline, and this trebling was before accounting for the sugar content of fruit juices, smoothies, or any of the undisclosed foods used to adjust energy intake to match energy expenditure.

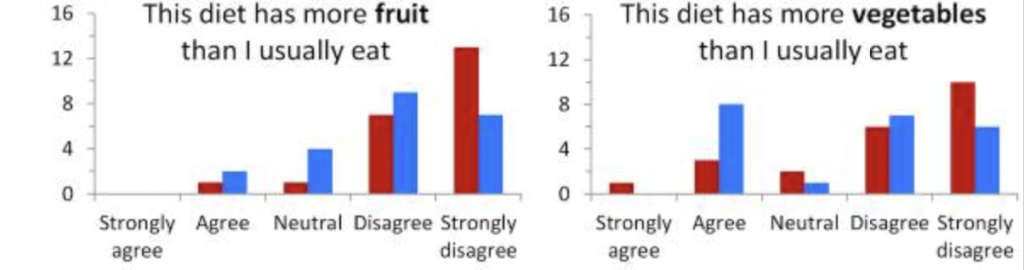
To make matters worse, in a follow-up analysis of the study, the original dietary participants reported pretty bizarre feelings about the intervention: 17 of 19 participants did not agree they ate more fruit compared to their usual diet, and 11 of 19 did not agree they ate more vegetables compared to their usual diet. How an intervention like this gets through peer review, I legitimately have no idea.
Another issue seen in the RCTs by Krishnan et al. and with another of the RCTs by Reidlinger et al., is that the energy intake of the dietary guideline intervention was scaled to match each participant’s estimated energy required, i.e. to prevent body weight loss. Strangely, I’ve actually heard people use these studies as evidence that the dietary guidelines do not promote weight loss, without realising that the researchers quite literally avoided bodyweight change by design. This is fine, but the question that the study is answering is whether there are any health benefits or issues independent of body weight. The answer to that question is yes. Although not all health markers improve, we wouldn’t really expect them to when body weight is stable and the intervention doesn’t accurately reflect the guidelines.
- Krishnan et al. found that the dietary guidelines significantly reduced blood pressure and led to nonsignificant reductions in total cholesterol, low-density lipoprotein concentrations (LDL-C), and HOMA-IR. The poor dietary guideline intervention likely blunted the magnitude of these changes, but there is also something to be said for the low sample size and lack of statistical power (only 22 subjects).
- The RCT by Reidlinger et al. included 162 participants and used a more accurate reflection of the dietary guidelines. In this study, the intervention group significantly lowered systolic and diastolic blood pressure in the daytime (-4.2 and -2.5mm Hg) and nighttime (-2.9 and -1.9mm Hg), hsCRP (-36%), total cholesterol (-0.46mmol/L), LDL cholesterol (-0.30mmol/L), apolipoprotein B (-0.065g/L), HDL cholesterol (-0.10mmol/L), apolipoprotein A (-0.043g/L), and triglycerides (-0.12mmol/L). Interestingly, these intervention benefits were even found against a control diet labelled as nutritionally balanced, including 5 servings of fruit and vegetables per day, moderate sodium intake, and < 15% total energy from saturated fat.
- In the RCT by Gotfredsen et al., there were no significant changes in health markers compared to the control group. However, looking at the supplementary data on dietary changes from baseline to month 6 of intervention, there were almost no differences in dietary composition: added sugar was already <10% total calories at baseline and reduced up to 0.09% with intervention; saturated fat was 13% of total calories at baseline and reduced up to 1.51% with intervention; dietary fibre was ~10 grams per 1000kcal intake at baseline and increased by 1 gram per 1000kcal with intervention. There were also no significant differences in meat or fruit and vegetable intake changes between baseline and intervention. So not only were baseline diets actually very close to achieving the dietary goals of the guidelines to begin with, but the guideline intervention itself barely improved dietary quality. Little to no change, little to no benefit. The authors also noted their study may have suffered from healthy user bias given that, at baseline, patient mean hbA1C, total cholesterol, diastolic blood pressure, and fasting cholesterol were all in the healthy range, and mean systolic blood pressure, BMI and LDL-C were only very marginally outside the healthy range.
“Dietary guidelines are not appropriate for treating chronic diseases”
As I briefly mentioned earlier, much of the criticism for dietary guidelines is simply due to misunderstanding their intentions and how they should be implemented in public health policy. People assume the dietary guidelines are trying to position themselves as the holy grail of dietary advice and suitable in all contexts, but this is a fabrication of the truth and what’s stated in the contents of dietary guideline documents. In the latest version of the US dietary guidelines, for example, they repeatedly clarify that they are not meant for direct use by the public:
- “The information in the Dietary Guidelines is used to develop, implement, and evaluate Federal food, nutrition, and health policies and programs… An important audience is health professionals and nutrition program administrators who work with the general public to help them consume a healthy and nutritionally adequate diet and establish policies and services to support these efforts”.
- “developed and written for a professional audience. Therefore, its translation into actionable consumer messages and resources is crucial to help individuals, families, and communities achieve healthy dietary patterns”.
- “The aim of the Dietary Guidelines is to promote health and prevent disease. Because of this public health orientation, the Dietary Guidelines is not intended to contain clinical guidelines for treating chronic diseases. Chronic diseases result from a complex mix of genetic, biological, behavioral, socioeconomic, and environmental factors, and people with these conditions have unique health care requirements that require careful oversight by a health professional… it is essential that Federal agencies, medical organizations, and health professionals adapt the Dietary Guidelines to meet the specific needs of their patients as part of an individual, multifaceted treatment plan for the specific chronic disease… Medical and nutrition professionals may use or adapt the Dietary Guidelines to encourage their patients or clients to follow a healthy dietary pattern”.
- “explicitly emphasize that a healthy dietary pattern is not a rigid prescription. Rather, the Guidelines are a customizable framework of core elements within which individuals make tailored and affordable choices that meet their personal, cultural, and traditional preferences”.
The above quotes from the dietary guidelines speak volumes to those criticising them for promoting hard and out rules. Just the word guideline should be a clear giveaway to their intended purpose – they are a guide, not a rule. Yes, many of the guidelines recommendations have nuances and details that are not discussed in the document itself, but that is why they target a professional audience who are able to interpret and adjust the information as necessary.
“The Dietary Guidelines never change, are formulated by bad scientists, and are not based on the best evidence”
Possibly one of the more frustrating arguments against the dietary guidelines is that they never change even when there is new evidence that opposes them. I’m not really sure where this narrative came from or what made it a popular opinion, but it’s just plain wrong. Sure, since 1980 and the introduction of the guidelines, there have been consistent recommendations to increase the consumption of fruits, vegetables, and whole grains, and reduce the consumption of saturated fat, sugars, and sodium, but which of these recommendations is controversial? These six nutrients, foods, or food groups, are arguably those with the most robust bodies of evidence for changing population health with different levels of intake. There is good reason why they were in the initial guidelines and have remained ever since; the body of evidence was and still is in their favour. It has little to do with a lack of people wanting to change the guidelines, and critics need to stop assuming that lack of change is necessarily bad. It isn’t.
The ‘body of evidence’ part from above is particularly important as the dietary guidelines clearly state they “must be grounded in the body of scientific and medical knowledge available at that time, not in individual studies or individual expert opinion“. People expecting groundbreaking changes to the dietary guidelines in each 5-year update, which isn’t a particularly long time in the grand scheme of nutrition science, are barring on delusional. Sure, we can expect some minor changes to the dietary guidelines with each update due to the evolving nature of scientific knowledge, but only across multiple guideline updates will there ever be a drastic change, and this is under the assumption that the evidence base supports such a change.
Possibly one of the more major shifts in more recent updates of the guidelines, though, is its second premise. This premise moves away from a reductionist outlook on public health recommendations and instead takes a top-down approach where dietary patterns are a greater concern than individual nutrients. Dietary goals for individual nutrients remain, but these are achieved as a byproduct of the dietary patterns recommended. The guidelines specifically state to “focus on dietary patterns. Researchers and public health experts, including registered dietitians, understand that nutrients and foods are not consumed in isolation. Rather, people consume them in various combinations over time—a dietary pattern—and these foods and beverages act synergistically to affect health”. The four key points to this second premise are as follows:
- Follow a healthy dietary pattern at every life stage.
- Customize and enjoy nutrient-dense food and beverage choices to reflect personal preferences, cultural traditions, and budgetary considerations.
- Focus on meeting food group needs with nutrient-dense foods and beverages, and stay within calorie limits. This means the core elements of the dietary pattern should be from fruits, vegetables, grains (mainly wholegrains), dairy, protein-foods (lean meats, eggs, seafood, legumes, nuts etc), and oils.
- Limit foods and beverages higher in added sugars, saturated fat, and sodium, and limit alcoholic beverages.
And for anyone who tries to argue that these guideline updates (or lack of) are decided by your average scientist who has been plucked out of a hat, think again. The most recent dietary guidelines were constructed after a 16-month synthesis of the evidence by 20 nationally recognised scientific experts as part of a Guidelines Advisory Committee, including a mix of practitioners, epidemiologists, scientists, and clinical trialists. The review involves data analysis of dietary patterns and disease trends, nutrition-evidence systematic reviews focused on nutrition and disease prevention, and food pattern modelling focused on predicting how changes in dietary intake affect population nutrient needs.

The review process is not secretive and these experts can be held accountable for their reasoning and (lack of) change from previous guidelines, too. The review process is transparent for anyone that cares to keep up with it. During the review period that spans 16 months in total, six of the Committee’s meetings are open to the public, and two of these allow for verbal public commentary. Written public comments are also encouraged during the first 15 months of the review process before a final public meeting takes place for the committee to draft their scientific report. Further public commentary is then encouraged after the report has been presented. I’m really not sure how much more transparency you can ask for throughout a review process. Public transparency aside, the draft guidelines are not even accepted at this point. The draft must then go through multiple internal and external reviews. The draft guidelines are first reviewed by agencies such as the USDA’s Food and Nutrition Service and its Food Safety and Inspection Service, and HHS’ National Institutes of Health, Food and Drug Administration, and Centers for Disease Control and Prevention. Then, the draft guidelines undergo external peer review to ensure that the contents accurately reflect the wider literature, as interpreted by other experts in the field. So, with all this in mind, believing that the people in charge of the dietary guidelines are purposefully not making changes and there is no accountability involved are just ignorant to the process. The process is fine – you just don’t like the results, which is also fine.
Final Thoughts
The dietary guidelines are subject to an unbelievable amount of unjust criticism. Yes, they are not a perfect diet for everybody, but that isn’t their purpose and they do not claim to be. I believe that people criticising the dietary guidelines need to do something: read the guidelines. This sounds harsh, but there is really no other way to put it. As I’ve discussed, the dietary guidelines are simply a collection of primary recommendations that have each been validated independently. A great deal of well-conducted observational research also shows greater adherence to the dietary guidelines improves public health outcomes, even after multivariable adjustment. If you don’t want to follow the guidelines and have found another approach that helps you, amazing, continue doing that. But don’t misrepresent the guidelines and spread misinformation. Your efforts are better spent elsewhere.
If you have enjoyed this article, please consider supporting the site by donating here and subscribing to our email list below (we don’t spam!).


